The three text web services and the testing webpage are now available at
http://130.88.90.134:8080/TextServices/
This page has a link to the extraordinarily simple userguide, links to the 3 wsdl documents for the web services and links to 3 taverna workflows that you can use to invoke the services.
If you want to submit a pdf to the SOAP interface of the text extraction service it must be submitted as a String of binary encoded as Base64.
I use the commons-codec Java class Base64 for this. It is very simple to use.
Or you can use the Taverna base64 encoder and decoders, these work fine as well and don't require any programming.
Sunday, July 01, 2007
Thursday, June 07, 2007
A google web toolkit webapp to test out my web services (TextServices)
The three services currently available are
- PdfToText service: Uses an http post form to upload a pdf, it returns the plain text extracted from that pdf. It makes use of base64 to decode and encode both the binary pdf file and returned string. Because the string will commonly carry characters that are xml invalid.
- TextClassification service: You give it some text and it tells you which of the four standard article sections it is most likely to come from. You can also just type in whatever text you want. There are some amusing examples below.
- TextRetrieval service: This service will give you a random section of text from our Open Access full text database, based on articles from PMC and BMC. This can then be pasted in to the classifier box, and you can test it out.
"This paper is not only destined to become seminal but is also highly original"Classified as a section of type: INTRODUCTION
"We used complicated pieces of software and overly detailed protocols."Classified as a section of type: METHODS
"As one variable went up the other one came down."Classified as a section of type: RESULTS
"Our findings are wide-ranging and at least 10 times better the anyone elses."Classified as a section of type: DISCUSSION
This is real output from the classifier.
When and if i'm able to get the website publically accessible. I'm definitely going to provide these as examples.


Finishing off
In order to provide a good quality error assessment of the classifiers abilities.
I've retrained it on 10,000 BMC sections and used this to classify 10,000 PMC sections.
These two section sets should be mutually exclusive. However i'm not sure they are, because PMC distributes BMC content. I'll have to look in to this overlap.
Anyway here is the result
not bad considering that when you train on all sections (over 300,000) then you get this for 10,000 classifications.
nice
I've retrained it on 10,000 BMC sections and used this to classify 10,000 PMC sections.
These two section sets should be mutually exclusive. However i'm not sure they are, because PMC distributes BMC content. I'll have to look in to this overlap.
Anyway here is the result
Sect    Corr    Incor    Precis    Recall    F-Measure
INTROD    2308    839    0.7334    0.8809    0.8004
METHOD    1927    503    0.793    0.9432    0.8616
RESULT    1311    218    0.8574    0.8023    0.829
DISCUS    2672    222    0.9233    0.7216    0.8101
Correct: 8218 proportion correct: 0.8218 percentage correct: 82.17999999999999
Incorrect: 1782 proportion incorrect: 0.1782 percentage incorrect: 17.82
724482ms
not bad considering that when you train on all sections (over 300,000) then you get this for 10,000 classifications.
Sect    Corr    Incor    Precis    Recall    F-Measure
INTROD    2166    804    0.7293    0.8794    0.7973
METHOD    2041    536    0.792    0.9281    0.8547
RESULT    1409    443    0.7608    0.8508    0.8033
DISCUS    2525    76    0.9708    0.6858    0.8038
Correct: 8141 proportion correct: 0.8141 percentage correct: 81.41000000000001
Incorrect: 1859 proportion incorrect: 0.1859 percentage incorrect: 18.59
585402ms
nice
Friday, April 13, 2007
Final mistakes and their corrections
I found out I was multiplying the class prior (the prob of finding that class given any document) by every token probability. This is not correct it should be:
Instead i was doing
I've also rejigged the number of tokens the classifier uses to classify the document. I want to allow all tokens to be used. But it tends to get biased by words that occur in all the classes or 2 or 3 of the classes. So even though i've eliminated the stoplist for a nicer statistical calculation, I still have a static limit of the 50 most differentially used tokens between classes. Never mind.
Latest results are really good.
The best yet (from 10,000 sections)
However you do have to remember that the testing is based on the documents it was traiend on. Which has obvious implications. However because its a statistical classifier I feel ok about using the same documents for training and testing. However i will prepare a proper independent test data set when im fully happy with it.
Let ci = class prior prob for class i
Let ti = token prior prob for token i
P = ci+t1+t2+t3...+tn
Instead i was doing
P = (ci+t1)+(ci+t2)+(ci+t3)....+(ci+tn)
I've also rejigged the number of tokens the classifier uses to classify the document. I want to allow all tokens to be used. But it tends to get biased by words that occur in all the classes or 2 or 3 of the classes. So even though i've eliminated the stoplist for a nicer statistical calculation, I still have a static limit of the 50 most differentially used tokens between classes. Never mind.
Latest results are really good.
The best yet (from 10,000 sections)
Sect Corr Incor Precis Recall F-Measure
INTROD 1910 824 0.6986 0.7755 0.735
METHOD 2018 837 0.7068 0.9177 0.7986
RESULT 1469 783 0.6523 0.8871 0.7518
DISCUS 2079 80 0.9629 0.5646 0.7119
Correct: 7476 proportion correct: 0.7476 percentage correct: 74.76
Incorrect: 2524 proportion incorrect: 0.2524 percentage incorrect: 25.240000000000002
However you do have to remember that the testing is based on the documents it was traiend on. Which has obvious implications. However because its a statistical classifier I feel ok about using the same documents for training and testing. However i will prepare a proper independent test data set when im fully happy with it.
Thursday, April 12, 2007
Training
Finished training the classifier on the open access corpus.
I think
says it all. It took a while.
The table has 1,080,554 unique words in it.
Here is some output from 1000 sections
I think
BUILD SUCCESSFUL (total time: 756 minutes 37 seconds)
says it all. It took a while.
The table has 1,080,554 unique words in it.
Here is some output from 1000 sections
Sect Corr Incor Precis Recall F-Measure
INTROD 125 47 0.7267 0.5507 0.6266
METHOD 195 121 0.6171 0.9701 0.7544
RESULT 182 96 0.6547 0.8922 0.7552
DISCUS 206 28 0.8803 0.5598 0.6844
Correct: 708 proportion correct: 0.708 percentage correct: 70.8
Incorrect: 292 proportion incorrect: 0.292 percentage incorrect: 29.2
The Bayesian Sectioniser
The bayesian text classifier, now classifies sections of articles into one of four classes (introduction, methods, results, discussion). At the moment i've trained it on 1000 open access articles (from BMC and PMC). It works well i use it to reclassify the same articles but the quality of its classification really does drop down when i give it sections that it has not been trained on. This is not good.
The reason i created a statistical classifier was I liked the ease with which you can get a handle on the accuracy of your results. However as it has evolved it has become necessary to include all different kinds of tweaks and alterations that have no real statistical basis and will probable not be suitable to different types of text. This is why i decided to work out a proper statistical way to improve the classifiers performance.
The biggest problem it has is that often the words used to calculate the overall probability of any given section belonging to any given class of article section do not vary in their probabilities of occurence between classes. A good example is the word "the", people usually use stop word lists to ignore all these common words. I don't like stop word lists, because i often get the feeling that common words can be useful. A good example is the word "were" it occurs 20,727 times in my current 1000 article training set. 56% of these occurences occur in methods sections, 32% in results, 3% in introductions and 9% in discussions. So clearly it is a good discriminatory word but it is almost always in included in standard stop word lists (see here). So I decided to get rid of the stop word list and replace it with a simple calculation that gives you words that vary in their occurence between classes. I use the sample standard deviation and normalise it with respect to the word mean occurence. Sure this can give you words that are used in exaclty the same frequencies in 3 classes and not at all in the fourth, but either way it seems to work quite well. Here is the top 10.
A lot of these are obviously related to methods text. For example 'usa' is used lots in methods sections when people are declaring where they bought their 'kit's and which 'inc's sold them the goods and how they might have 'washed' their blots.
When i ran the classifier over a 1000 (takes 3.5 mins) articles I got this
P = precision
R = recall
F-m = F-measure
However when i ran it over 10,000 articles (took 27 mins) i got this.
I now need to optimise it a bit because it currently does a SELECT query to retrieve the class probabilities for each token in the text. This is a lot of overhead. That I could remove by using an IN("token1","token2","token3") type of query that is sorted into the same order as the list of tokens in the IN() section.
Not that great but perhaps it could do with training on the whole open access corpus.
Either way its a nice tool that hopefully can have some good applications.
I'll be making a nice visual web frontend for it soon.
using the Google Web Toolkit, which i like a lot, because it lets you program in Java but then compiles it into cross-browser compatible javascript. It also lets you make your pages asynchronous, which is nice. No more pointless page reloads every time you change something.
The reason i created a statistical classifier was I liked the ease with which you can get a handle on the accuracy of your results. However as it has evolved it has become necessary to include all different kinds of tweaks and alterations that have no real statistical basis and will probable not be suitable to different types of text. This is why i decided to work out a proper statistical way to improve the classifiers performance.
The biggest problem it has is that often the words used to calculate the overall probability of any given section belonging to any given class of article section do not vary in their probabilities of occurence between classes. A good example is the word "the", people usually use stop word lists to ignore all these common words. I don't like stop word lists, because i often get the feeling that common words can be useful. A good example is the word "were" it occurs 20,727 times in my current 1000 article training set. 56% of these occurences occur in methods sections, 32% in results, 3% in introductions and 9% in discussions. So clearly it is a good discriminatory word but it is almost always in included in standard stop word lists (see here). So I decided to get rid of the stop word list and replace it with a simple calculation that gives you words that vary in their occurence between classes. I use the sample standard deviation and normalise it with respect to the word mean occurence. Sure this can give you words that are used in exaclty the same frequencies in 3 classes and not at all in the fourth, but either way it seems to work quite well. Here is the top 10.
'usa'
'instructions'
'inc'
'washed'
'conclusion'
'committee'
'santa'
'discussion'
'germany'
'kit'
A lot of these are obviously related to methods text. For example 'usa' is used lots in methods sections when people are declaring where they bought their 'kit's and which 'inc's sold them the goods and how they might have 'washed' their blots.
When i ran the classifier over a 1000 (takes 3.5 mins) articles I got this
P = precision
R = recall
F-m = F-measure
INTRODUCTION P: 0.35353535353535354 R: 0.14583333333333334 F-m: 0.2064896755162242
METHODS P: 0.732824427480916 R: 0.9014084507042254 F-m: 0.8084210526315789
RESULTS P: 0.9375 R: 0.7638888888888888 F-m: 0.8418367346938775
DISCUSSION P: 0.6450381679389313 R: 0.8622448979591837 F-m: 0.7379912663755459
Correct: 730 proportion correct: 0.6880301602262017 percentage correct: 68.80301602262017
Incorrect: 331 proportion incorrect: 0.31196983977379833 percentage incorrect: 31.196983977379833
However when i ran it over 10,000 articles (took 27 mins) i got this.
INTRODUCTION P: 0.3986175115207373 R: 0.27970897332255457 F-m: 0.3287410926365795
METHODS P: 0.5770573566084788 R: 0.5235294117647059 F-m: 0.5489916963226572
RESULTS P: 0.709049255441008 R: 0.37221888153938665 F-m: 0.4881703470031546
DISCUSSION P: 0.5684830633284241 R: 0.8348202216815356 F-m: 0.6763771766509692
Correct: 5556 proportion correct: 0.5530559426637468 percentage correct: 55.30559426637468
Incorrect: 4490 proportion incorrect: 0.44694405733625325 percentage incorrect: 44.694405733625324
I now need to optimise it a bit because it currently does a SELECT query to retrieve the class probabilities for each token in the text. This is a lot of overhead. That I could remove by using an IN("token1","token2","token3") type of query that is sorted into the same order as the list of tokens in the IN() section.
Not that great but perhaps it could do with training on the whole open access corpus.
Either way its a nice tool that hopefully can have some good applications.
I'll be making a nice visual web frontend for it soon.
using the Google Web Toolkit, which i like a lot, because it lets you program in Java but then compiles it into cross-browser compatible javascript. It also lets you make your pages asynchronous, which is nice. No more pointless page reloads every time you change something.
Wednesday, April 11, 2007
Parsing XML into a DOM
When you have a DOM of an XML document life becomes easier. You can XPath's to extract single nodes or lists of nodes that you can then operate on. The problem with DOM however is the whole document needs to be parsed into a tree of nodes. Often this is very inefficient. I mostly use the DOM for XML parsing, the DOM is created using the xerces parser, i'm sure there are faster parsers out there but at the moment i can't be bothered finding and downloading one. However I am now processing thousands of BMC and PMC open access articles and the DOM parsing time is beginning to become a problem. However because these documents tend to be highly structured (see here for BMC and here for PMC dtd and XML markup info) you really do need XPath's and therefore DOM's of documents. I could write a custom SAX parser but i really do feel this would be a waste of time. As an example my computer which has a 2.2GHZ athlon takes roughly 3 hours to parse, extract the full text, section text and article metadata from the roughly 50,000 xml documents available from BMC and PMC.
Monday, February 05, 2007
ISMB submission
Last week i finised a submission to ISMB in vienna in june.
I managed to get it done in a week which was good for me.
We titled it "A methodology for identifying methodologies from full text from literature"
We wanted to keep it to a description of how we did what we did, some of the many! tech problems we had to solve and how succesful this kind of thing can be. Clearly many elements can be improved, but thats more reason to get it out there. Surely there must be some proper text miners who are sick of PPI's and abstracts and want to solve some new problems, well, i've got plenty.
The best bit about the whole article is the final figure.
This was drawn using my java3D software, using my data andmy ideas over how to present the data.
Its nice to do something all by yourself that is actually quite novel and reasonable succesful in its aims.
The image describes the usage of different workflows through time (z-axis). Each workflow is represented by a shape, the diameter of which determined by it usage in each year. Colour is determined by the first use of the workflow. The x,y clustering of the workflows is specified by a radial tree, inferred using the NJ algorithm and a distance matrix of f-measure term similarity values.

I managed to get it done in a week which was good for me.
We titled it "A methodology for identifying methodologies from full text from literature"
We wanted to keep it to a description of how we did what we did, some of the many! tech problems we had to solve and how succesful this kind of thing can be. Clearly many elements can be improved, but thats more reason to get it out there. Surely there must be some proper text miners who are sick of PPI's and abstracts and want to solve some new problems, well, i've got plenty.
The best bit about the whole article is the final figure.
This was drawn using my java3D software, using my data andmy ideas over how to present the data.
Its nice to do something all by yourself that is actually quite novel and reasonable succesful in its aims.
The image describes the usage of different workflows through time (z-axis). Each workflow is represented by a shape, the diameter of which determined by it usage in each year. Colour is determined by the first use of the workflow. The x,y clustering of the workflows is specified by a radial tree, inferred using the NJ algorithm and a distance matrix of f-measure term similarity values.

Results of classifier
Some very cool results from the classifier.
It doesn't actually fare any better at the number of articles it finds methods text for than simple regexs based on journal formatting strcuture.
However the text is so much better.
e.g.
Regex:
start match"Material and Methods
We did this with then this with this. 5.0 for 6c of 2ul of 1 aliquot.
Results
It came out at 1.5, this is less than exp 4. Expt 1 failed.
Discussion
this is very important of yes. If we look at the results"end match
This happens because if you use start and end regexes you get matches all over the place and devising a good wa\y to decide which portion actually contains the methods is very hard. So i tended to say, if its bigger its more likely to contain the methods, so use that, after all its still excluding the refs, which are the worse source of false positive term matches.
With bayesian you get this:
"We did this using this"
"We also used this working in conjunction with this."
and then sometimes
"This figure was drawn using this method and this software."
This is very cool, so not only do you get more accurate method identification you also get other bits of text that can be said to be "methodological in nature".
This is a very nice result.
I'm going to extend this into a full-scale article mark up classifier.
with each chunk given the classification of its most probable section type.
This shouldn't be too hard with the help of the BMC articles.
Thanks BMC.
It doesn't actually fare any better at the number of articles it finds methods text for than simple regexs based on journal formatting strcuture.
However the text is so much better.
e.g.
Regex:
start match"Material and Methods
We did this with then this with this. 5.0 for 6c of 2ul of 1 aliquot.
Results
It came out at 1.5, this is less than exp 4. Expt 1 failed.
Discussion
this is very important of yes. If we look at the results"end match
This happens because if you use start and end regexes you get matches all over the place and devising a good wa\y to decide which portion actually contains the methods is very hard. So i tended to say, if its bigger its more likely to contain the methods, so use that, after all its still excluding the refs, which are the worse source of false positive term matches.
With bayesian you get this:
"We did this using this"
"We also used this working in conjunction with this."
and then sometimes
"This figure was drawn using this method and this software."
This is very cool, so not only do you get more accurate method identification you also get other bits of text that can be said to be "methodological in nature".
This is a very nice result.
I'm going to extend this into a full-scale article mark up classifier.
with each chunk given the classification of its most probable section type.
This shouldn't be too hard with the help of the BMC articles.
Thanks BMC.
The bayesian classifier
Obviously this post has taken some considerable time to get round to.
No i haven't just been working on the classifier.
this post will update on the classifier:
I've incorporated it into the exisiting textminer project that i've been working on for the last year.
Training:
I extracted 1,000 methods sections from the BMC datamining set of articles, which is a fantastically useful for stuff like this, it consists of roughly 28,000 articles all in XML.
Pity the articles don't really use all the features in the DTD, so for example the Methods section is not marked as type:methods or type:1, where 1 = methods section in the DTS, instead you tend to get this. (sec)(title)Materials and Methods(/title)....(/sec). This is a shame really. Why can't BMC, a single publishers that is very involved with all its content (unlike PMC) ramp up the mark up a bit.
So in order to get 1,000 reliable methods the code had to parse through ~6,000 articles.
You then chunk the article according to double newline characters (described below)
remove the confounding chars
Tokenise the chunk
Check database for word presence in table
if present increase count
otherwise insert new row
At the end of all this i calc a posterior prob for each token
these are then used to calc a combined prob.
I used word counts instead of presence absence because of the number of tokens involved (quite large) in each methods section and i felt it would help the calculation, however this is unproven because i haven't implemented a presence/absence style.
The database is in mySQL, after learning a bit more about the Collections framework in java it may have been easiser to use sets and maps. But automating queries is so simple it may not have been.
Classification:
Get a chunk of text, the chunk being the product of a tokeniser using double newline \n characters or on windows two sets of \r\n, the regex therefore being \r\n\r\n (windows) or \n\n (pure java, linux, mac etc.)
Then replace all the symbols, punctuation and \r\b\t with null, leaving only spaces in the string.
Then tokenise using " ".
You then look up the posterior prob in the database for each word in the chunk.
You then calc the interestingness of all tokens ( |0.5 - posterior_prob| , note the absolute).
I then used the top 20 most interesting tokens to calc the chunk prob.
I also requuired a certain number of tokens per chunk to avoid, short sections being missclassified.
No i haven't just been working on the classifier.
this post will update on the classifier:
I've incorporated it into the exisiting textminer project that i've been working on for the last year.
Training:
I extracted 1,000 methods sections from the BMC datamining set of articles, which is a fantastically useful for stuff like this, it consists of roughly 28,000 articles all in XML.
Pity the articles don't really use all the features in the DTD, so for example the Methods section is not marked as type:methods or type:1, where 1 = methods section in the DTS, instead you tend to get this. (sec)(title)Materials and Methods(/title)....(/sec). This is a shame really. Why can't BMC, a single publishers that is very involved with all its content (unlike PMC) ramp up the mark up a bit.
So in order to get 1,000 reliable methods the code had to parse through ~6,000 articles.
You then chunk the article according to double newline characters (described below)
remove the confounding chars
Tokenise the chunk
Check database for word presence in table
if present increase count
otherwise insert new row
At the end of all this i calc a posterior prob for each token
these are then used to calc a combined prob.
I used word counts instead of presence absence because of the number of tokens involved (quite large) in each methods section and i felt it would help the calculation, however this is unproven because i haven't implemented a presence/absence style.
The database is in mySQL, after learning a bit more about the Collections framework in java it may have been easiser to use sets and maps. But automating queries is so simple it may not have been.
Classification:
Get a chunk of text, the chunk being the product of a tokeniser using double newline \n characters or on windows two sets of \r\n, the regex therefore being \r\n\r\n (windows) or \n\n (pure java, linux, mac etc.)
Then replace all the symbols, punctuation and \r\b\t with null, leaving only spaces in the string.
Then tokenise using " ".
You then look up the posterior prob in the database for each word in the chunk.
You then calc the interestingness of all tokens ( |0.5 - posterior_prob| , note the absolute).
I then used the top 20 most interesting tokens to calc the chunk prob.
I also requuired a certain number of tokens per chunk to avoid, short sections being missclassified.
Tuesday, September 19, 2006
Naive Bayesian Classifier
Hoping to classify paragraphs into sections from scientific articles.
Good explanation of basic calculations
especially on how to combine the probs of individual words into a single document prob
look at
Survey of text mining : clustering, classification, and retrieval / Michael W. Berry (Editor).
Blogged with Flock
Wednesday, August 16, 2006
Information on JCR metrics
Total Cites
The total number of times that a journal has been cited by all journals included in the database in the JCR year.
Citations to journals listed in JCR are compiled annually from the JCR year’s combined database, regardless of which JCR edition lists the journal and regardless of what kind of article was cited or when the cited article was published. Each unique article-to-article link is counted as a citation.
Citations from a journal to an article previously published in the same journal are compiled in the total cites. However, some journals listed in JCR may be cited-only journals, in which case self-cites are not included.
The journal impact factor is the average number of times articles from the journal published in the past two years have been cited in the JCR year.
The impact factor is calculated by dividing the number of citations in the science citation index by the total number of articles published in the two previous years. An impact factor of 1.0 means that, on average, the articles published one or two year ago have been cited one time. An impact factor of 2.5 means that, on average, the articles published one or two year ago have been cited two and a half times. Citing articles may be from the same journal; most citing articles are from different journals.
The aggregate impact factor for a subject category is calcuted the same way as the impact factor for a journal, but it takes into account the number of citations to all journals in the category and the number of articles from all journals in the category. An aggregate impact factor of 1.0 means that that, on average, the articles in the subject category published one or two years ago have been cited one time. The median impact factor is the median value of all journal impact factors in the subject category.
The impact factor mitigates the importance of absolute citation frequencies. It tends to discount the advantage of large journals over small journals because large journals produce a larger body of citable literature. For the same reason, it tends to discount the advantage of frequently issued journals over less frequently issued ones and of older journals over newer ones. Because the journal impact factor offsets the advantages of size and age, it is a valuable tool for journal evaluation.
The impact factor trend graph shows the impact factor for a five-year period. To view the graph, click the Impact Factor Trend button at the top of the journal page.
The immediacy index is the average number of times an article is cited in the year it is published. The journal immediacy index indicates how quickly articles in a journal are cited. The aggregate immediacy index indicates how quickly articles in a subject category are cited.
The immediacy index is calculated by dividing the number of citations to articles published in a given year by the number of articles published in that year.
Because it is a per-article average, the immediacy index tends to discount the advantage of large journals over small ones. However, frequently issued journals may have an advantage because an article published early in the year has a better chance of being cited than one published later in the year. Many publications that publish infrequently or late in the year have low immediacy indexes.
For comparing journals specializing in cutting-edge research, the immediacy index can provide a useful perspective.
Journal Citing Half-Life
The citing half-life is the median age of articles cited by the journal in the JCR year. For example, in JCR 2003, the journal Food Biotechnology has a citing half-life of 9.0. That means that 50% of all articles cited by articles in Food Biotechnology in 2003 were published between 1995 and 2003 (inclusive).
Only journals that publish 100 or more cited references have a citing half-life. do not have a citing half-life.
The aggregate citing half-life is calculated the same way as the journal citing half-life, and its significance is comparable. For a subject category, the citing half-life is the median age of articles cited by journal in the category in the JCR year.
For example, in JCR 2003, the subject category Geochemistry & Geophysics has a citing half-life of 9.9. That means that 50% of all articles cited by articles in Geochemistry & Geophysics journals in 2003 were published between 1994 and 2003 (inclusive).
technorati tags:JCR, metrics, bibilometrics, citation data
Blogged with Flock
Friday, June 16, 2006
Some data from a preliminary test data set
This graph is the product of some queries from a test version of the text mining database.
The test database has about 1000 articles in it which are spread through several years.

The data has been normalised to acount for the number of articles in the databse per year.
There seems to be a downward trend in most of traditional methods of phylogenetic inference.
e.g. Neighbor-joining (neighbour-joining), maximum parsimony, maximum likelihood.
And yet a quite obvious upturn in the use of bayesian inference of phylogeny.
This would certainly fit with recent trends in phylogenetics.
The test database has about 1000 articles in it which are spread through several years.

The data has been normalised to acount for the number of articles in the databse per year.
There seems to be a downward trend in most of traditional methods of phylogenetic inference.
e.g. Neighbor-joining (neighbour-joining), maximum parsimony, maximum likelihood.
And yet a quite obvious upturn in the use of bayesian inference of phylogeny.
This would certainly fit with recent trends in phylogenetics.
Wednesday, May 10, 2006
An ontology for phylogenetics
Here is a very weird ontology that I am using for my entity recognition and markup process from my text mining system.
An example is below

the full ontology can be donwloaded and viewed from here
that is all
An example is below

the full ontology can be donwloaded and viewed from here
that is all
Monday, April 10, 2006
Things to investigate from Jena
SVM's, particularly hyperplanes through space
Look at morpho-guessing
Ontology to NER, classes/groups
java method 3Dto2D
http://tinyurl.com/p5sr7
http://tinyurl.com/pkf8o
http://tinyurl.com/m43t2
Look at morpho-guessing
Ontology to NER, classes/groups
java method 3Dto2D
http://tinyurl.com/p5sr7
http://tinyurl.com/pkf8o
http://tinyurl.com/m43t2
Tuesday, March 28, 2006
Here is also an interesting bit of info
This is something i wasn't really aware of.
In a scan through ~200 journal of virology papers with the search "phylogenetic*" in abstract or title, maximum likelihood was the most popular tree-inference method. closely followed by neighbor-joining and the jukes-cantor model of nucleotide substitution was the most popular from the list screened (see below). Also the command-line only version of clustal; version w was much more popular than the GUI/user-friendly clustalX.
In a scan through ~200 journal of virology papers with the search "phylogenetic*" in abstract or title, maximum likelihood was the most popular tree-inference method. closely followed by neighbor-joining and the jukes-cantor model of nucleotide substitution was the most popular from the list screened (see below). Also the command-line only version of clustal; version w was much more popular than the GUI/user-friendly clustalX.
neighbor$joining 137
parsimony 94
likelihood 156
bayesian 26
upgma 9
p-distance 5
jukes-cantor 21
kimura$2-parameter 8
kimura$3-parameter 0
tamura-nei 20
f81 3
hky 13
general$time-reversible 14
dayhoff 13
jtt 6
wag 2
modeltest 17
model$of$nucleotide 17
model$of$protein 3
clustal$x 36
clustal$w 84
An update on what is happening
I have moved very strongly into the world of text-mining.
Essentially we are looking to get an idea of how people do their phylogenetics
by extracting it from papers. Im doing pretty well with the extracting side of things but how to visualise the data isn't so straightforward. Should it be a network and ontology or just a chart and what is the best way to visualise these.
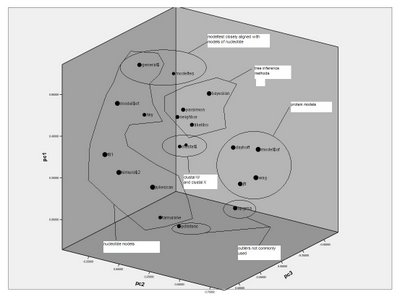
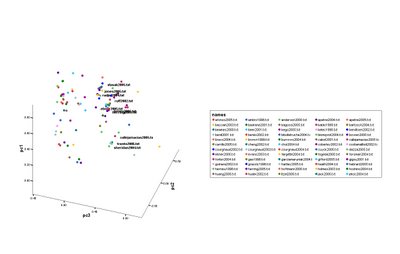
Essentially we are looking to get an idea of how people do their phylogenetics
by extracting it from papers. Im doing pretty well with the extracting side of things but how to visualise the data isn't so straightforward. Should it be a network and ontology or just a chart and what is the best way to visualise these.


Thursday, January 12, 2006
Consensus trees and XML models
Read a lot of Felsensteins work on consensus trees.
Ml consensus tree methods "l" varies from 0% to 100% as a value that is used to determine if a group should be collapsed. e.g. l = 50%, so all groups that occur in more than 50% of the trees will be drawn in the final consensus tree. 50% is the value used in the Majority Rule Consensus Tree (MRCT) method. Obviously because anything over 50% has to be in the majority.
Still working on literature review, not sure how much i've written, but theres definitely some very core sections still to write.
Wanted to try out tree-like data structures in java today. Thought occured to me to create java data structures that represent all objects from phylogenetics. But it would need java which makes it a bad idea. A better idea was to create XML schema or models (or whatever the word is) for each entity within the great phylogenetic ontology.
I should try to do this above. I might try it for a DNA sequence.
Need to think about what elements a sequence needs, what are the elements, what are they called, what type are they, what data do they contain.
draft DNA sequence XML schema
ID TYPE DATA
---------------------------------------------
NAME STRING GI345642
LENGTH INTEGER 20
DNA STRING CATCGTCGATCTCGATCGAT
---------------------------------------------
transferring these between programs would make things a lot easier.
you would still need a parser for taking data from a prog and converting it to this and then putting it into this.
If we surround existing software with a transparent data transfer service we need a million interfaces to interconvert data. LOTS of boring text parsing. A waste of time.
We need a core set of components that all talk to each other using a standard defined ontology.
People would only use a system of this type if it had all the features they use, rather than trying to provide it for them. Tools should be made available that can put custom progs into the system. Or at a stretch tell people how to rewrite their software to work with system but this prob wouldn't work.
I should provide custom versions of the most popular software, e.g. blast, clustalW, phylip.
Big job really, but perhaps a toy system could work, I could use it to link units together each units having inputs and outputs. A bit like IRIS explorer.
Ml consensus tree methods "l" varies from 0% to 100% as a value that is used to determine if a group should be collapsed. e.g. l = 50%, so all groups that occur in more than 50% of the trees will be drawn in the final consensus tree. 50% is the value used in the Majority Rule Consensus Tree (MRCT) method. Obviously because anything over 50% has to be in the majority.
Still working on literature review, not sure how much i've written, but theres definitely some very core sections still to write.
Wanted to try out tree-like data structures in java today. Thought occured to me to create java data structures that represent all objects from phylogenetics. But it would need java which makes it a bad idea. A better idea was to create XML schema or models (or whatever the word is) for each entity within the great phylogenetic ontology.
I should try to do this above. I might try it for a DNA sequence.
Need to think about what elements a sequence needs, what are the elements, what are they called, what type are they, what data do they contain.
draft DNA sequence XML schema
ID TYPE DATA
---------------------------------------------
NAME STRING GI345642
LENGTH INTEGER 20
DNA STRING CATCGTCGATCTCGATCGAT
---------------------------------------------
transferring these between programs would make things a lot easier.
you would still need a parser for taking data from a prog and converting it to this and then putting it into this.
If we surround existing software with a transparent data transfer service we need a million interfaces to interconvert data. LOTS of boring text parsing. A waste of time.
We need a core set of components that all talk to each other using a standard defined ontology.
People would only use a system of this type if it had all the features they use, rather than trying to provide it for them. Tools should be made available that can put custom progs into the system. Or at a stretch tell people how to rewrite their software to work with system but this prob wouldn't work.
I should provide custom versions of the most popular software, e.g. blast, clustalW, phylip.
Big job really, but perhaps a toy system could work, I could use it to link units together each units having inputs and outputs. A bit like IRIS explorer.
Subscribe to:
Posts (Atom)
